93%
of breaches result from application source code defects
56%
of breaches involve data loss
$4.45M
USD is the average cost of a data breach, with median loss of 12 data records
$387M
is the average data breach cost of the 250 known mega breaches, with >= 50M data records loss
<0.1%
of breaches involve ransomware
$30K
is the median extortion value of ransomware, with a maximum of $47M and only 25 events of > $1M
An Actuarial Science based approach
Actuarial science applies probability analysis and statistics against big data to define, analyze, and quantify the financial impact of uncertain future events.
The world knows how to protect things of value, whether it is life, home, or health. You start with decades of longitudinal data about loss events – data such as causes, frequencies, loss amounts. With this data, you determine financial risks of uncertain future events by applying actuarial science against past events. It is no different to quantify risk with cybersecurity.
An actuarial based approach to cyber threat management has not been automated to date due to the lack of longitudinal data on cybersecurity. CyberSagacity provides the first and only tools using actuarial science for cybersecurity. CyberSagacity’s tools are enabled by 3 decades of proprietary longitudinal data on software source and defect behavior. This data is coupled with 25 years of historic financial data from insurance industry databases, nearing 1 million loss situations.

Expected Financial Loss & ROI
Our tools are a financial compass telling you where you are going.
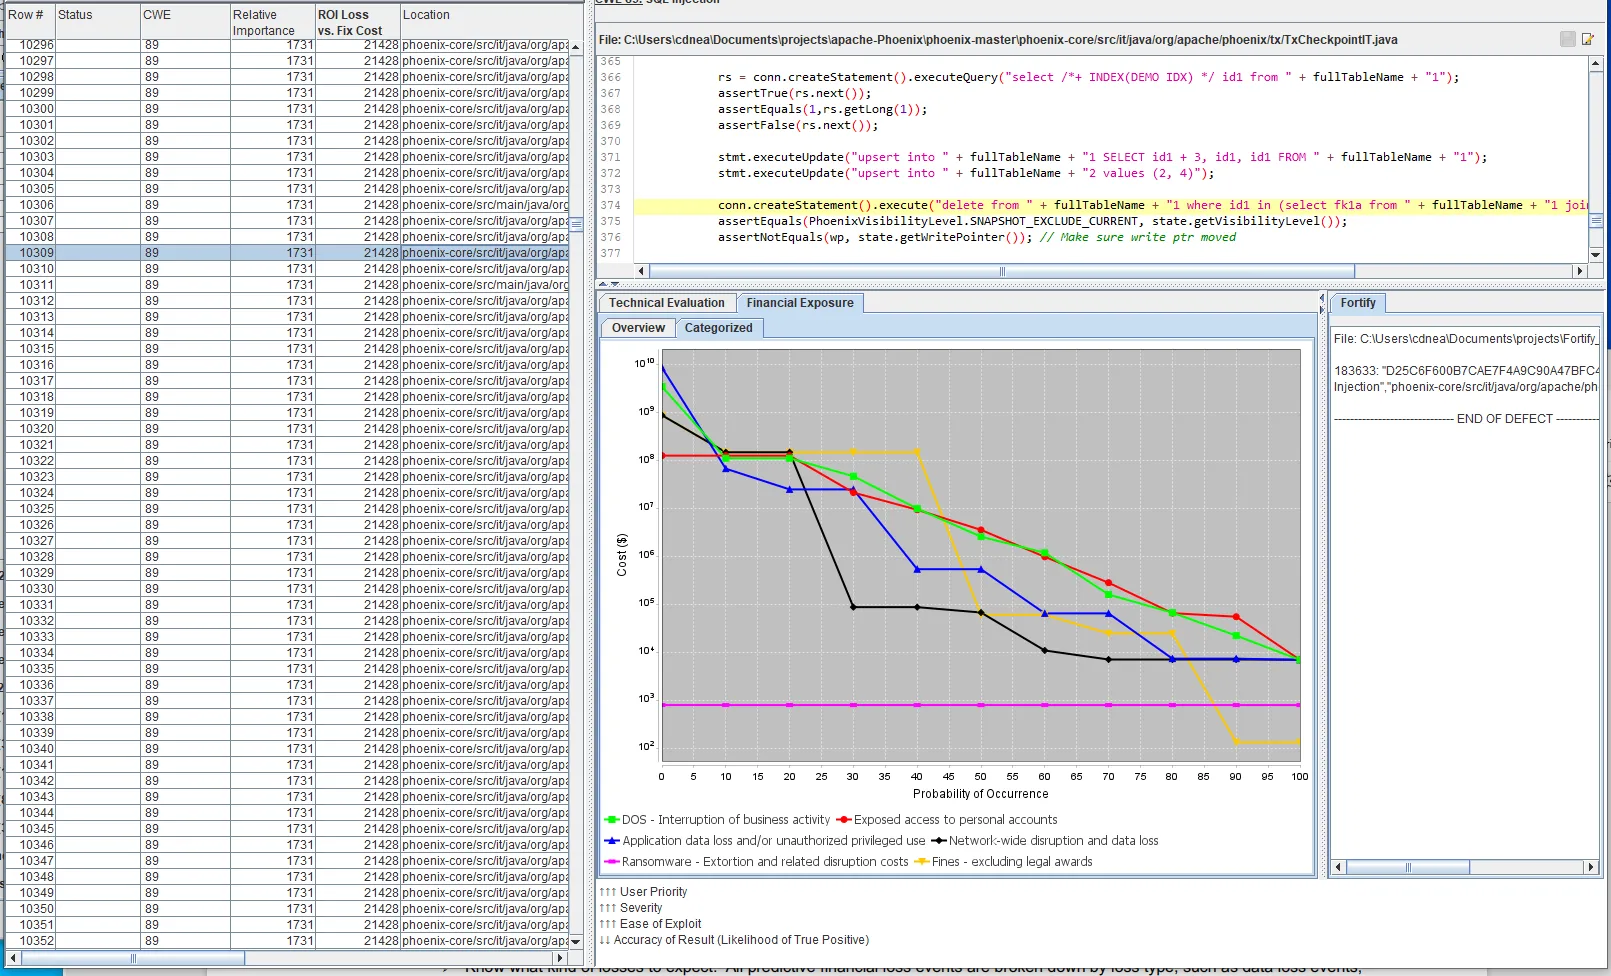
- Know what is important and what is not: SATriage provide predictive values of breach likelihood and financial loss for every defect found by application security tools.
- Know you are working on the right things: Return on investment (ROI) figures are calculated comparing potential future loss vs resolution cost of each defect.
- Track your progress to lower your financial risk exposure: The expected 3-year financial loss associated with every software project is quantified.
- Know what kind of losses to expect: All predictive financial loss events are broken down by loss type, such as data loss events, DOS, ransom, and fines.
Power of a Common Business Language:
C-Suite, CISO
The CISO can routinely inform the board on risk: “We have an expected $25M total loss for cybersecurity events with our applications over the next several years and with $200K of investment, we can reduce that expectation to below $1M loss.”
M&A, Technical Management
Acquisitions teams can say that acquisition of Firm X and use of their software systems places an extra $50M cybersecurity risk to our company. Software managers can determine the fiscal/resource/ and time risks associate with the use of open source vs in-house software solutions.
Risk Management
Up to 90% of our cybersecurity budget is insurance. SATriage determines our application portfolio currently has an expected median financial risk of $10M, with a 25% chance of a $27M loss. Let’s size our cybersecurity insurance levels in line with our financial loss exposure, instead of our $100M policy. We can be both responsible and cost-effective for our stakeholders.
Technical Management, Security, DevOps
I know which defects we must fix, why we must fix them, and the order to fix them to realize the steepest path to lower risk. I know that we need to fix these 150 defects to secure our applications after which we can safely stop our application security work.
Software Development
“This defect is easy to exploit and will cause a $3M loss to our business, if breached. I should spend a day to fix it.” “That defect will cost more time and money to fix than any reasonable expectation of loss to the business. “I understand why this defect is technically important, here are the ways it can be attacked and what can happen when an attack occurs.”